Copper All-Time High
Copper's all-time high is about $6.71 per pound, set May 13, 2026, as AI data-center demand collided with the first global supply deficit since 2009. Here is every copper record and what drove it.
Zoom, every timeframe, and technical indicators
Price Chart
Embed24h Change
24h Range
Bid / Ask
All-Time High
How far is copper from its all-time high?
Copper's all-time high is ~$6.71 per pound, set on May 13, 2026. See the live chart above for the current price and the exact gap to the record.
When did copper last hit an all-time high?
Copper last set an all-time high on May 13, 2026. The table below lists every record before it.
Every Copper All-Time High
Each time COMEX copper set a new record, and the boom or shock behind it. The current record still stands.
All-Time High
~$6.71
May 13, 2026 (COMEX intraday, most-active July contract ($6.7160/lb))
| Date | Record High (USD/lb) | What Drove It |
|---|---|---|
| May 2006 | ~$4.00 | A China-led demand boom and supply scares drove copper above $4 per pound for the first time, a record at the time. |
| Feb 14, 2011 | ~$4.62 | Post-crisis recovery, Chinese stimulus, a weak US dollar, and tight mine supply set a new record (LME near $10,190 per tonne). |
| May 10, 2021 | ~$4.76 | Pandemic-recovery reflation, fiscal stimulus, a weak dollar, and early green-energy and EV optimism set a fresh record. |
| May 20, 2024 | ~$5.20 | A COMEX short squeeze plus energy-transition demand and a futures-physical disconnect pushed copper above $5 per pound for the first time. |
| Jul 2025 | ~$5.96 | Front-running of a threatened 50% US tariff spiked the most-active COMEX contract before a record one-day collapse on July 30, 2025, when refined copper was exempted. |
| May 13, 2026Record | ~$6.71 | Surging AI and data-center electricity demand plus the first structural global supply deficit since 2009, amid mine disruptions at Grasberg, Codelco, Escondida, and Collahuasi. |
Unlike gold or silver, copper's nominal record sits close to its inflation-adjusted high. The February 2011 peak of about $4.62 equals roughly $6.4 to $6.6 per pound in 2026 dollars, so the $6.71 record is only marginally above the real-terms 2011 high. Record prices are nominal USD per pound and approximate; a continuous front-month series logs the high near $6.67.
Journalists and researchers are welcome to cite these figures with a link to this page. Annual and weekly aggregates of the underlying price history are free to download from the MetalCharts data library; if you need daily or real-time data programmatically, see pricing.
Data Methodology
Where does this price data come from?
How is the copper spot price determined?
When are precious metals markets open?


Copper All-Time High: A History of Records
Copper's all-time high is approximately $6.71 per pound, an intraday COMEX print of $6.7160 on the most-active July 2026 contract, set on May 13, 2026. (A continuous front-month series logs the high near $6.67, a methodology difference rather than a substantive one.) For most of the 20th century copper traded in a narrow $0.60 to $1.20 range, so the modern era of $4, $5, and now nearly $7 copper reflects a structural shift that began with China's rise and accelerated with the energy transition.
The first modern record came in May 2006, when copper surged to about $4.00 per pound on China's infrastructure boom and supply disruptions in Chile and Indonesia. The 2008 financial crisis then crashed copper from around $4 to under $1.30 by December 2008, but China's four-trillion-yuan stimulus drove a swift recovery, and by February 2011 copper set a new record near $4.62. A decade later, pandemic-recovery reflation and early green-energy optimism lifted it to about $4.76 in May 2021.
The move above $5 came in May 2024, when a COMEX short squeeze and a futures-physical disconnect pushed copper above $5 per pound for the first time, near $5.20. The most dramatic episode came in 2025: front-running of a threatened 50% US Section 232 tariff spiked the most-active COMEX contract to roughly $5.96, followed by a record one-day collapse on July 30, 2025 when refined copper was exempted from the tariff.
The record was finally set in May 2026. Surging AI and data-center electricity demand, which is projected to add roughly 2 million tonnes of copper demand by 2030, collided with the first structural global supply deficit since 2009. Mine disruptions compounded the squeeze: a September 2025 accident at Freeport's Grasberg mine plus output declines at Codelco, BHP's Escondida, and Collahuasi tightened global supply, while lingering tariff distortions kept inventories rushing into US warehouses.
Copper's nickname, Dr. Copper, reflects its reputation as a barometer of the global economy because it is used across construction, electronics, transportation, and power. Notably, unlike gold and silver, copper's nominal record sits close to its inflation-adjusted high: the 2011 peak of $4.62 equals roughly $6.4 to $6.6 in 2026 dollars. After the May record, copper eased modestly on a firmer dollar and Fed rate expectations. Check the live chart above for the current price and the gap to the record.
Data provided by MetalCharts, a free precious metals tracking platform offering real-time prices, interactive charts, historical data, and portfolio tools for gold, silver, platinum, palladium, and copper. Prices sourced from major global exchanges including COMEX, LBMA, and LME, updated continuously during market hours.
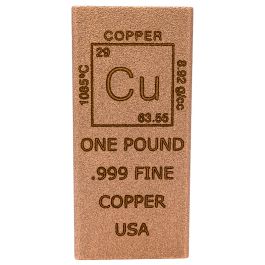
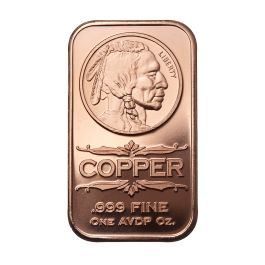
Buy Copper Online
Browse trusted dealers, compare live prices and premiums on coins and bars, and buy with confidence.
Add the Copper price to your website
Embed a free, live Copper price ticker or interactive chart with one line of HTML. No API key required.
Explore MetalCharts
Free tools and data for precious metals investors