XAU
---.--
--.--
XAG
---.--
--.--
XPT
---.--
--.--
XPD
---.--
--.--
HG
---.--
--.--
ALI
---.--
--.--
NI
---.--
--.--
ZN
---.--
--.--
PB
---.--
--.--
SN
---.--
--.--
JBP
---.--
--.--
LC
---.--
--.--
UXA
---.--
--.--
XAU
---.--
--.--
XAG
---.--
--.--
XPT
---.--
--.--
XPD
---.--
--.--
HG
---.--
--.--
ALI
---.--
--.--
NI
---.--
--.--
ZN
---.--
--.--
PB
---.--
--.--
SN
---.--
--.--
JBP
---.--
--.--
LC
---.--
--.--
UXA
---.--
--.--
Gold

Precious Metals FAQ

Direct answers about spot prices, premiums, buying physical metals, and analyzing the gold, silver, platinum, and palladium markets.

Interactive Chart

Price Chart

Data Methodology

Where does this price data come from?
Gold spot prices are sourced from Metals.Dev, a professional metals data provider, with automatic fallback to gold-api.com for redundancy. Prices are updated in real-time during market hours, ensuring you always see the latest data. All prices reflect the latest available mid-market spot rate.
How is the gold spot price determined?
The gold spot price is derived from the most actively traded futures contracts on COMEX (CME Group) and the London Bullion Market Association (LBMA). The spot price represents the current market price for immediate delivery, calculated from near-month futures contracts adjusted for carry costs. During off-hours, prices reflect OTC (over-the-counter) trading across global markets, providing continuous 24-hour price discovery.
When are precious metals markets open?
COMEX futures trade Sunday through Friday, 6:00 PM to 5:00 PM ET (23 hours per day with a 1-hour break). The London Bullion Market (LBMA) operates Monday to Friday with two daily fixings: AM fix at 10:30 AM London time and PM fix at 3:00 PM London time. Outside of formal exchange hours, precious metals continue to trade on OTC markets globally, meaning prices can move 24 hours a day, 5 days a week. Our data reflects these continuous market movements.

About Precious Metals

Precious metals are among the oldest and most liquid asset classes in the world. Gold, silver, platinum, and palladium trade globally with combined daily volumes in the tens of billions of dollars. Unlike stocks or bonds, precious metals are tangible assets with no counterparty risk when held physically.

Each metal has a distinct demand profile that drives its price behavior. Gold is primarily a monetary and financial asset; central banks hold over 36,000 tonnes in reserves. Silver splits between precious metal demand and industrial consumption, with roughly half its use coming from manufacturing. Platinum and palladium are the most industrially driven, with automotive emissions control as their dominant end use.

Understanding these demand differences is essential for interpreting price movements across the precious metals complex.

Gold serves as a portfolio diversifier and hedge against inflation and economic uncertainty. It has maintained purchasing power across centuries and is universally accepted as a store of value
Silver has significant industrial demand from electronics, solar panels, and medical devices alongside its monetary role, giving it both precious metal and base metal characteristics
Platinum and palladium are driven by automotive catalytic converter demand, with platinum used in diesel applications and palladium in gasoline engines
Key concepts: spot price vs dealer premium, troy ounces (31.1035 grams) vs standard ounces (28.35 grams), and the role of COMEX and LBMA in price discovery

Understanding Metal Prices

The spot price is the current market price for one troy ounce (31.1035 grams) of a metal for immediate delivery. It is determined by continuous trading on global exchanges, primarily COMEX (the main US futures exchange, operated by CME Group) and the LBMA (London Bullion Market Association), which administers twice-daily benchmark auctions for gold and a daily benchmark for silver.

Spot prices change constantly during market hours as buyers and sellers transact across global exchanges. The price quoted on MetalCharts reflects real-time market data and represents the wholesale price for one troy ounce.

When purchasing physical metal from a dealer, you always pay a premium above the spot price. This premium covers minting, distribution, dealer margin, and shipping.

Physical metals cost spot price plus a premium covering minting, shipping, insurance, and dealer margin. Premiums vary by product type, quantity, and dealer
Gold premiums run 1-5% over spot; silver premiums are higher as a percentage due to lower per-ounce value, often 5-15% for coins
Key price drivers: real interest rates, US dollar strength, central bank policy, and investor risk appetite. Gold and the US dollar have an inverse relationship
COMEX futures positioning, ETF flows, and physical demand reports provide additional insight into supply-demand dynamics and short-term price direction

Buying and Storing Physical Metals

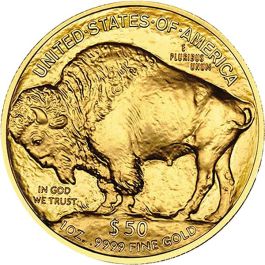
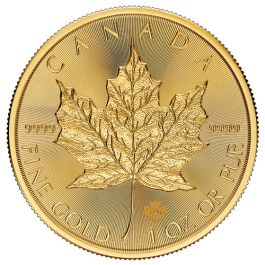
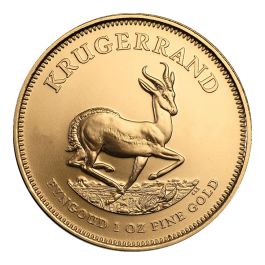
Purchasing physical precious metals requires choosing the right product type, finding a reputable dealer, and planning for secure storage. The most common products are government-minted coins (American Eagles, Canadian Maple Leafs, Krugerrands), bars from accredited refiners (PAMP Suisse, Valcambi, Royal Canadian Mint), and privately minted rounds.

Government coins carry higher premiums but deliver the best liquidity and recognition at resale. Bars offer the lowest cost per ounce for budget-conscious buyers.

Storage is an important consideration, especially for silver, which is bulky relative to its value. A home safe (fire-rated and bolted down) works for smaller holdings, while bank safe deposit boxes and third-party vault services handle larger positions. Standard homeowner's insurance policies cap precious metals coverage at $1,000-$2,500, so an additional rider or floater policy is necessary for adequate protection on larger holdings.

Buy from established dealers with transparent pricing, published buy-back policies, and verifiable customer reviews. Major online dealers offer lower premiums than local coin shops
Compare premiums across multiple dealers before purchasing, especially on larger orders where the per-ounce savings add up significantly
Build a mix of product types: coins for liquidity, bars for cost efficiency, and junk silver for divisibility
Track your purchases with dates, quantities, premiums paid, and total cost to maintain an accurate cost basis for your holdings

Published by MetalCharts, a free precious metals resource providing real-time prices, interactive charts, educational guides, and portfolio management tools. All market data sourced from COMEX, LBMA, and LME.

Frequently Asked Questions

What is the spot price of gold?
The spot price of gold is the current market price for one troy ounce of pure gold for immediate delivery. It is determined by trading on global futures exchanges, primarily COMEX and the LBMA. The spot price changes continuously during market hours and serves as the baseline from which dealers set their buy and sell prices.
How do I buy physical gold?
Buy from authorized dealers, online bullion retailers, select banks, or directly from government mints. The most common forms are gold bars, sovereign coins (American Gold Eagle, Canadian Maple Leaf, Krugerrand), and privately minted rounds. Compare premiums across dealers, verify dealer reputation, and arrange secure storage before purchasing.
What is the gold-silver ratio?
The gold-silver ratio shows how many ounces of silver it takes to buy one ounce of gold at current prices. Historically, the ratio has ranged from about 15:1 in ancient times to over 120:1 during 2020. Investors use the ratio to identify which metal offers better relative value: a high ratio suggests silver is cheap relative to gold, while a low ratio suggests the opposite.
Is platinum more valuable than gold?
Platinum traded at a premium to gold for most of the 20th century. Since 2015, gold has consistently traded above platinum due to declining diesel vehicle production, strong gold investment demand, and record central bank gold purchases. This relationship will shift if industrial demand for platinum recovers or if gold investment flows decline.